Visualizing Hartford Crash and Trash Data with Professor Jack Dougherty
Students in Professor Jack Dougherty’s “Data Visualization for All” (EDUC 206) course have been working on visualizing Hartford “crash” and “trash” data this semester. In collaboration with the City of Hartford’s planning division and the Center for Leadership and Justice, students worked on projects such as “Analyzing The Impact of Hartford’s Traffic Calming Installations” and “Where Does Hartford Waste Go?”.

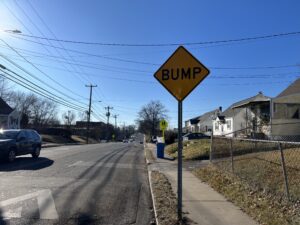
The former project, by Keelyn McNamara ’24, examined the impact of the City’s installation of traffic calming measures on the number of car crashes on Flatbush Avenue and New Britain Avenue. Using UConn’s crash data repository, McNamara found that crashes have decreased on both throughways since the installation of traffic calming measures. McNamara’s findings indicate that crashes decreased 28% on Flatbush Avenue since the 2018 installation of speed humps.
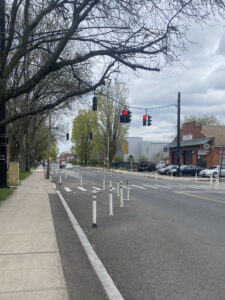
More recently, at the end of 2022, traffic delineators were installed on New Britain Avenue in response to the death of Trinity College student Jillian Hegarty. The white posts in the roadway aim to slow traffic speed and protect pedestrians and motorists. While data is limited due to the short time since the delineators were installed, McNamara found that initial data indicates a 69% decrease in crashes on New Britain Avenue.

“What surprised me the most was the drastic decrease in crash counts for the section of New Britain Avenue by Trinity College,” says McNamara, “In the seven months that the traffic delineators have been in place only four crashes were recorded compared to thirteen recorded in the same seven-month time frame a year ago. This analysis was definitely premature as only seven months of crash data is available, but it was really promising to see the immediate impact these traffic calming installations were having on crash counts.”
Another project team, Rashaud Conway ’24 and Travis Martin ’24, examined where Hartford waste goes since the closure of the Materials Innovation and Recycling Authority (MIRA) trash-burning energy plant in 2022. Using a story-map, they illustrate the economic and environmental costs to ship trash to out-of-state landfills in Pennsylvania and Ohio. They present alternatives for more in-state composting and recycling, which would reduce the negative impacts of the current trash processing methods.
Martin presented the findings in a session for first-year students at UConn medical school in April. In response to the presentations, Dr. Kirsten Ek, Assistant Professor of Medicine, who organizes special teaching events on public health in Hartford, said, “It was truthfully astounding (not in a good way…) to see what our state’s garbage plan is.”

Martin adds, “Creating visibility of where our trash is going and the communities affected by it is crucial for policy and practices that will assist in creating a more equitable world.”
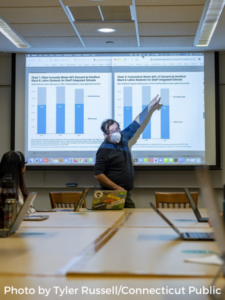
Dougherty’s class benefits students as they learn a skill that they can use in their future research or employment. It also benefits community partners, who have access to data, but need help turning that data into a story. “A lot of our community partners realize that we’re all swimming in data, but those numbers aren’t very meaningful until we can put them together in a narrative with some clear visual evidence to support that story,” says Dougherty.
Dougherty’s data visualization course will run again in the fall with a full roster of students and new community partners seeking ways to tell stories with data.
